Quick Answer
Key Takeaways
- Measure capacity, not simply activity.
- Track scope creep before temporary responsibilities become permanent.
- Separate strategic work from operational demand.
- Include meeting, decision and communication load — not just tasks.
- Use the dashboard to trigger workload decisions, not to create another reporting exercise.
Workload Dashboards for Leaders: See Overload Early
Workload dashboards for leaders solve a problem that most organisations handle badly: leadership overload is often invisible until somebody starts failing.
A senior leader can look productive while operating beyond sustainable capacity. Meetings are attended. Emails are answered. Decisions are made. Deadlines are met. From the outside, the system appears to be working.
Behind the scenes, strategic thinking may have disappeared. Decisions are being made late at night. Temporary responsibilities have become permanent. Recovery time is being consumed by work. The leader is compensating for a structural capacity problem through personal effort.
That is dangerous.
The World Health Organization defines burnout as an occupational phenomenon resulting from chronic workplace stress that has not been successfully managed, identifying exhaustion, increased mental distance or cynicism, and reduced professional efficacy as its three dimensions.
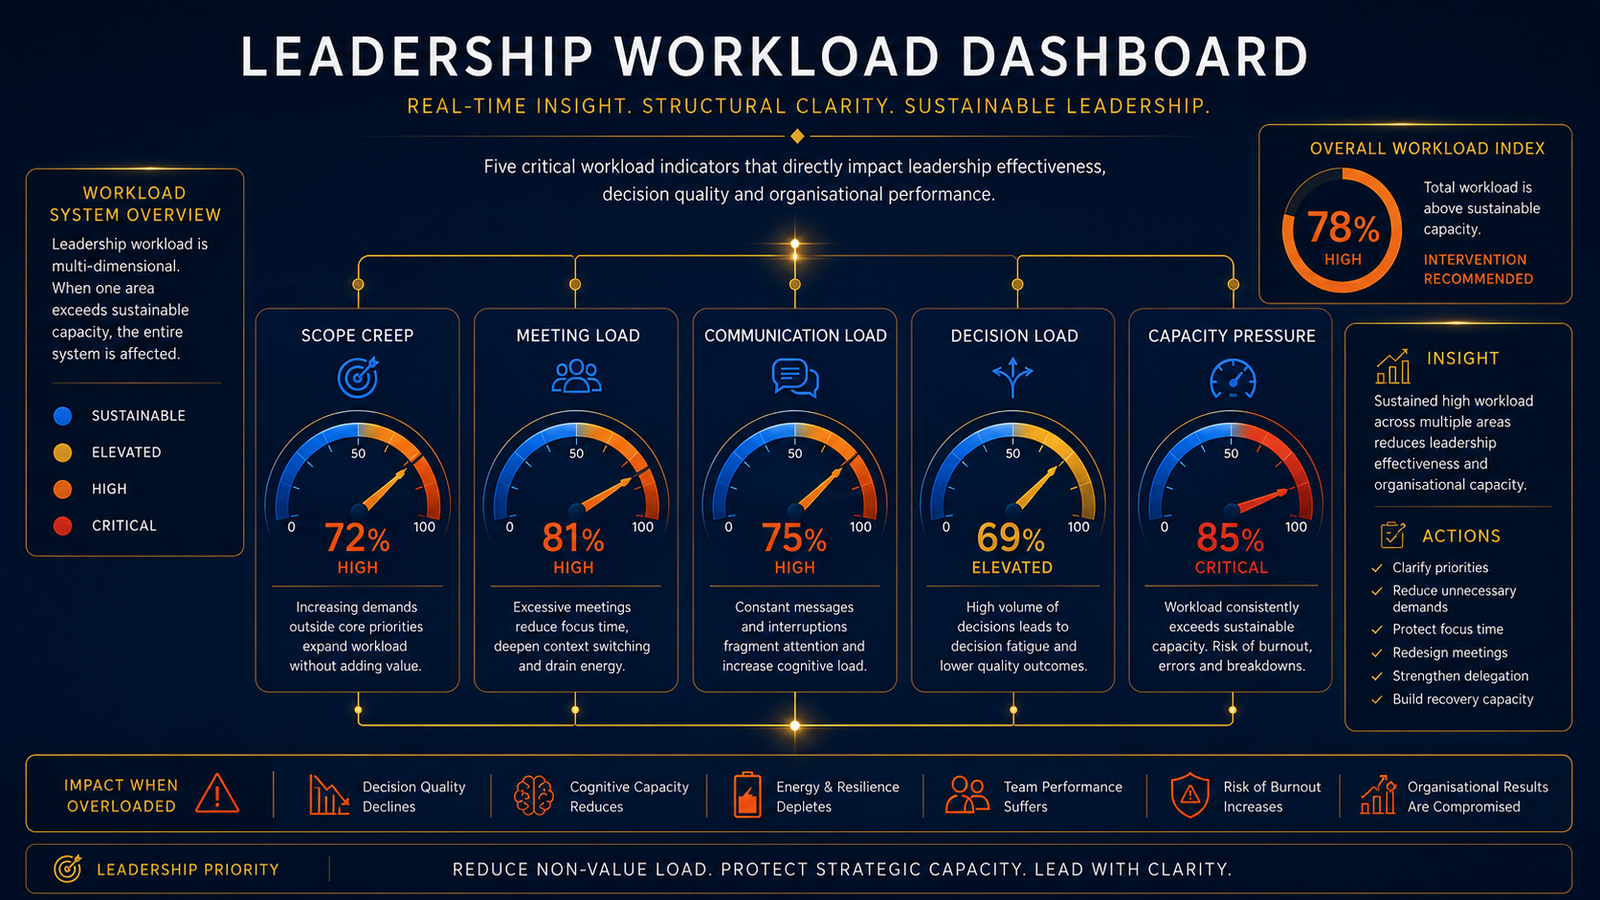
The Burn Bright approach therefore starts with a different question. Not: how can this leader become more resilient? But: what does the workload system actually look like? A workload dashboard makes that system visible. The Burn Bright framework identifies scope creep, meeting culture, communication chaos, decision overload and perfectionism culture as five structural root causes of burnout.
Featured Snippet
What Should Workload Dashboards for Leaders Measure?
A useful dashboard does not measure everything. It measures what helps you make decisions. That distinction matters because badly designed dashboards create more administration — leaders end up spending additional time collecting information about why they have no time. Start with six measures.
Measure 1 Capacity Utilisation
Estimate realistic weekly capacity and compare it with committed demand. Do not assume every hour in the working week is available for scheduled output.
Measure 2 Strategic vs Operational Time
How much time is being spent on work that genuinely requires senior leadership judgement? If strategy repeatedly loses to administration and firefighting, the workload architecture is wrong.
Measure 3 Meeting Load
Measure meeting hours, but also fragmentation. Ten hours of meetings spread across five days can damage thinking capacity more than ten hours concentrated into defined blocks.
Measure 4 Decision Load
How many decisions reach the leader unnecessarily? Decision overload is one of the five root causes identified within the Burn Bright framework.
Measure 5 Scope Creep
Track responsibilities added to the role against responsibilities removed. A temporary project becomes permanent. A vacant position is covered “for now”. Nothing disappears.
Measure 6 Recovery Capacity
A sustainable workload cannot be calculated solely by asking whether enough hours exist to complete the work. Humans require recovery.
Gallup’s 2026 global workplace data found that 45% of managers experienced significant stress during the previous day, compared with 39% of individual contributors — making leadership capacity a management issue, not simply a diary issue. For leaders already operating close to their limit, the Leadership Burnout Self-Assessment can provide an additional diagnostic starting point.
Why Doesn’t a Normal Task List Reveal Leadership Overload?
Because tasks are only one component of leadership demand. Imagine two leaders, both with 20 significant tasks this week. Leader A has six hours of meetings, clear decision authority, an experienced team and protected strategic time. Leader B has 22 hours of meetings, 150 messages arriving across several channels, three vacancies, multiple unresolved decisions and responsibility for a project that was never part of the original role.
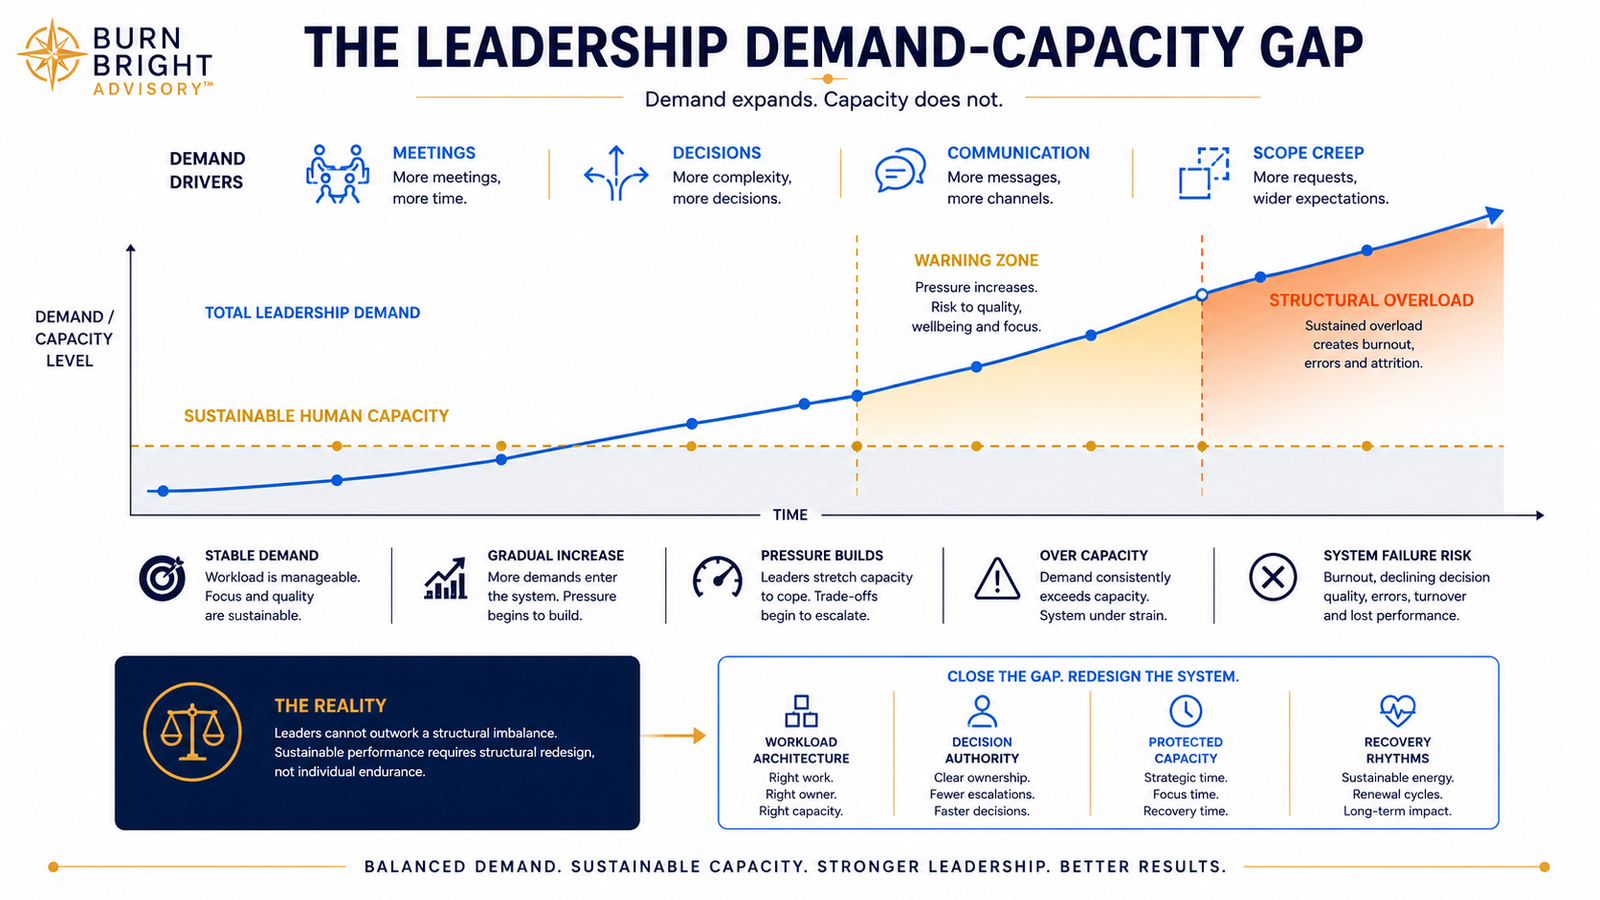
This is why traditional productivity systems can become misleading at senior levels — they focus heavily on visible output while ignoring the architecture surrounding the work. Leaders cannot outwork broken systems. Sustainable leadership requires systems thinking rather than dependence on individual heroics.
Gallup’s research reinforces this point, identifying five major drivers of burnout: unfair treatment, unmanageable workload, unclear communication from managers, lack of manager support and unreasonable time pressure. Notice what is missing — none of those causes is “poor personal resilience”. The problem is frequently the environment in which performance is expected.
A useful workload dashboard therefore moves beyond “what needs doing?” and asks instead: what system is producing the demand? That question changes the intervention. Instead of telling the leader to work faster, you might remove a meeting. Instead of improving email productivity, you might establish communication boundaries. Instead of asking for greater resilience, you might redistribute decision authority. That is Workload Architecture™.
How Can Leaders Build a Simple Workload Dashboard?
Start small. A dashboard that requires an analyst and 17 spreadsheets is unlikely to survive. A weekly red-amber-green review across six dimensions works well:
| Dashboard Measure | Green | Amber | Red |
|---|---|---|---|
| Capacity | Sustainable | Near limit | Demand exceeds capacity |
| Strategic time | Protected | Frequently interrupted | Consistently lost |
| Meeting load | Controlled | Expanding | Dominates calendar |
| Decision load | Appropriate | Leader becoming bottleneck | Excessive centralisation |
| Scope creep | Stable | New duties accumulating | Role materially expanded |
| Recovery | Protected | Frequently compromised | Regularly consumed by work |
Do not become obsessed with perfect thresholds. The first objective is visibility. Then look for trends. One red week during a major launch may be manageable. Eight consecutive amber weeks are different — that is no longer a difficult week, it is an operating model.
Deloitte found that 77% of professionals surveyed had experienced burnout in their current job, while 91% said unmanageable stress or frustration negatively affected the quality of their work. The relevance for leaders is straightforward: sustained overload eventually becomes an effectiveness problem.
The dashboard should lead to a weekly conversation built around three questions:
- What increased? Identify new meetings, projects, decisions, reporting requirements or responsibilities.
- What can move? Delegate, defer, automate, redesign or stop work that does not require the leader’s direct involvement.
- What must be protected? Strategic work, critical decisions and genuine recovery cannot always be whatever remains after everything else.
This connects directly to Workload Architecture™, one of the four structural transformation pillars in the Burn Bright Not Out Framework. The other three are Decision Authority™, Recovery Rhythms™ and Management Frameworks. The dashboard provides the diagnosis. Architecture provides the redesign.
How Do Workload Dashboards Expose Scope Creep?
Scope creep is dangerous because it usually arrives politely. “Could you cover this temporarily?” “Can you join this meeting?” “Would you oversee this project until we recruit?” Each request may be reasonable. The cumulative result may not be.
Scope creep is one of the five root causes of burnout because leadership roles tend to expand incrementally. The solution is to track additions and removals — create two simple dashboard fields: responsibilities added this month and responsibilities removed this month. If the first column grows while the second remains empty, you have useful evidence.
This changes the conversation with senior management. Instead of saying “I feel overwhelmed,” you can say: “My role has absorbed four additional recurring responsibilities this quarter. They require approximately nine hours of weekly capacity, but no existing responsibilities have been removed.” That is a different conversation — it converts a subjective complaint into an operational diagnosis.
This matters because scope creep can otherwise be mistaken for individual underperformance. A leader who managed the job successfully two years ago may now struggle — not because their capability declined, but because the job quietly became 1.4 jobs. Modern leaders are expected to manage strategy, operations, technology, people, communication, compliance and wellbeing simultaneously — a structural mismatch between expanding expectations and finite human capacity.
What Does the Data Tell Us About Structural Burnout?
The evidence increasingly points organisations towards work design. WHO explicitly identifies factors including time pressure, lack of control over work tasks, long working hours and lack of support as risks for occupational stress, burnout and fatigue, and recommends organisational interventions including workload reduction, schedule changes, improved communication and teamwork.
McKinsey’s research provides another useful signal: organisations in the top quartile for organisational health had a 25% burnout rate — around half the rate of the remaining organisations in its database. That should change how executives think about burnout. If organisational conditions substantially influence burnout rates, individual coping interventions cannot be the complete answer. The system matters.
Deloitte’s workforce research similarly found that 64% of managers surveyed were seriously considering changing jobs for one that would better support their wellbeing, and that 74% of employees struggled to take time off or disconnect from work.
A workload dashboard does not solve those problems by itself. It gives you something equally important: early visibility. Without visibility, organisations tend to discover leadership overload through consequences — a resignation, a missed target, an absence, a failed project, a deteriorating team. By then, the organisational cost can be considerable.
How Should Leaders Turn Dashboard Data Into Action?
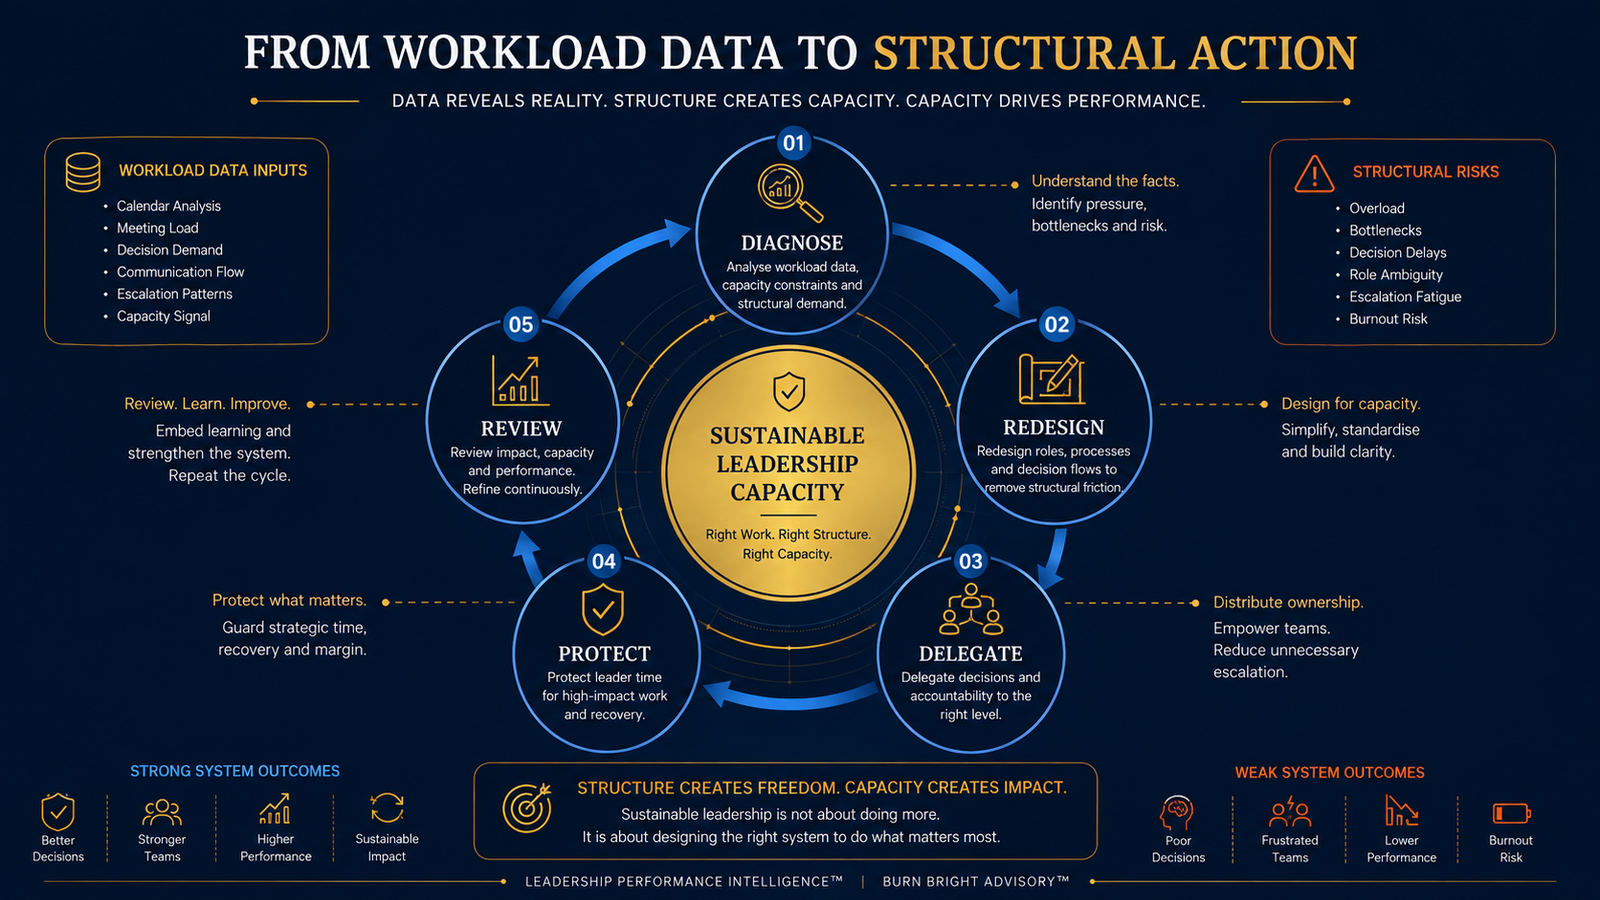
A dashboard becomes useless the moment it turns into decoration. Every red indicator needs a response — not necessarily an immediate solution, but a decision.
Eliminate
Does this work need to happen at all?
Delegate
Does it require this level of leadership authority?
Redesign
Can the process, meeting or communication channel be changed?
Defer
Does it genuinely need to happen now?
Escalate
Does the capacity problem require an organisational decision?
This approach prevents a common leadership mistake: responding to overload by becoming more efficient at doing work that should not exist. That is not sustainable leadership. It is efficient depletion. The Leadership Burnout Reset takes the same structural approach: diagnose the pressure before deciding what intervention is required.
The goal is not an empty calendar. Leadership contains pressure. Difficult periods happen. Crises occur. The goal is to distinguish temporary pressure from permanent structural overload — a useful workload dashboard helps leaders make that distinction before exhaustion becomes normalised.
Traditional Workload Management vs Sustainable Workload Architecture™
| Traditional Approach | Sustainable Workload Architecture™ |
|---|---|
| Measures completed tasks | Measures capacity and demand |
| Rewards visible busyness | Protects valuable output |
| Adds responsibilities incrementally | Tracks scope additions and removals |
| Treats meetings as fixed | Audits meeting demand |
| Centralises decisions | Clarifies decision authority |
| Uses personal effort as spare capacity | Preserves sustainable capacity |
| Reacts after burnout appears | Identifies overload early |
| Asks leaders to cope | Redesigns the system |
The difference is fundamental. Traditional management asks: can the leader carry more? Sustainable leadership asks: should the system be generating this load in the first place? That is the question organisations need to become better at answering.
Frequently Asked Questions
What is a workload dashboard for leaders?
A leadership workload dashboard is a simple management system for comparing work demands with available capacity. It typically tracks factors such as strategic time, operational work, meeting load, decision demand, scope creep and recovery. Its purpose is to reveal structural overload before it becomes burnout or performance decline.
What should be included in a leadership workload dashboard?
Start with six measures: capacity, strategic time, meeting load, decision load, scope creep and recovery capacity. More sophisticated dashboards can include communication volume, team vacancies, project demand and delegated responsibilities, but additional metrics should only be added when they improve decision-making.
How often should leaders review workload dashboards?
A short weekly review works well for operational visibility, with a deeper monthly review for structural trends. Look for patterns such as recurring overload, disappearing strategic time or responsibilities increasing without corresponding work being removed.
Can a workload dashboard prevent burnout?
No dashboard can guarantee burnout prevention. It can, however, expose workplace conditions associated with burnout early enough for intervention, since burnout is connected to chronic workplace stress that has not been successfully managed.
Should workload dashboards track hours worked?
Hours can be useful, but they are insufficient alone. Two 45-hour weeks can create completely different levels of cognitive demand depending on meetings, interruptions, decisions, conflict and task complexity. Measure the architecture of the workload rather than treating hours as the whole picture.
Will employees see workload dashboards as another performance tool?
They may if the dashboard is designed badly. Workload data should diagnose the system, not police individuals. If leaders use it to ask why someone is not producing more, trust will decline. If they use it to remove unnecessary demand and protect capacity, its purpose becomes clear.
Conclusion
Workload dashboards for leaders make something visible that organisations have traditionally allowed to remain hidden. Capacity.
Leadership overload rarely begins with one catastrophic event. It accumulates through another meeting, another project, another decision, another communication channel and another temporary responsibility that quietly becomes permanent. Eventually, personal effort becomes the mechanism holding the system together. That is precisely the point at which leadership becomes fragile.
The answer is not to build increasingly sophisticated ways of asking leaders to endure more. It is to redesign the conditions under which leadership happens. Measure workload. Track scope. Protect strategic time. Clarify decisions. Challenge unnecessary meetings. Preserve recovery capacity.
Most importantly, use the data to remove structural pressure.
Burnout is a system failure.
Fix the system, not the person.
Is Your Dashboard Already Showing Amber or Red?
Start with a diagnosis rather than another productivity technique. Take the free Leadership Burnout Self-Assessment.
Free Leadership Intelligence
Get Weekly Leadership Insights
Join thousands of leaders receiving practical strategies on burnout prevention, workload design, and sustainable performance every week.